Exploring the Impact of London's Fire Station Closures in 2014
Written by Stuart Mackenzie

London Fire Brigade Context
The London Fire Brigade (LFB) is one of the largest fire fighting and rescue organisations in the world. They deliver a vast array of services. In addition to responding to and dealing with fire incidents other examples of their services include; responding to floods, handling and disposing of hazardous materials, search & rescue, educating the public about safety and carrying out inspections.
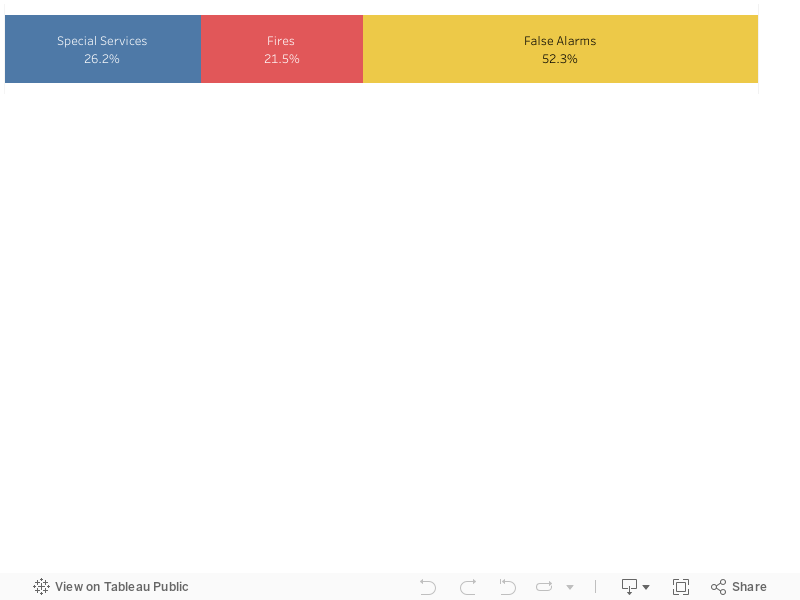
Between 2011 and 2018 the London Fire Brigade responded to an average of 97,137 incidents each year. Incidents are grouped into 3 different high-level categories; Fires, Special Services and False Alarms. It's worth noting that during the same period false alarms made up a staggering 52.3% of the incidents responded to over an 8 year period.
Proportion of incidents by type (2011 -2018)
Station Closures
Faced with budget cuts of 28.8 million pounds London Fire Brigade took the decision to closedown 10 of its 113 fire stations on the 9th January 2014. Some of the stations that closed were some of the busiest in London and the closures sparked several protests around the City. Alongside the station closures 552 firefighters lost their jobs as part of the cuts. Many feared that the cuts would put members of the public and residents of the areas affected at increased risk.
10 of 113 Fire Stations were closed in Jan 2014

The stations that closed and the boroughs they were situated in our shown in the table below. Included in this table is also the number of stations that remained open in each Borough after these stations were closed. The average across London is 3 stations per borough. This average is only provided as additional context as London Boroughs vary in both population size and geographical area.
| Station Name | London Borough | Stations remaining after closures |
|---|---|---|
| Belsize | Camden | 3 |
| Clerkenwell | Camden | 3 |
| Woolwich | Greenwich | 5 |
| Kingsland | Hackney | 3 |
| Knightsbridge | Kensington and Chelsea | 3 |
| Downham | Lewisham | 4 |
| Silvertown | Newham | 3 |
| Southwark | Southwark | 3 |
| Bow | Tower Hamlets | 5 |
| Westminster | Westminster | 2 |
Performance Over Time
A common measure of performance of fire services is the 'first pump attendance time'. This is the length of time it takes from a service being notified of an incident to attending the scene with an applicance and crew. It is widely accepted that the faster a crew can attend an incident the greater the opportunity to prevent incidents escalating, reduce incident related injuries & fatalities and prevent damage to property and posessions.
The London Fire Brigade measure and publish the 'first pump attendance time' for all incidents and use it as one of their Key Performance Indicators (KPIs). Using this information we can further explore the impact of the station closures that took place in January 2014.
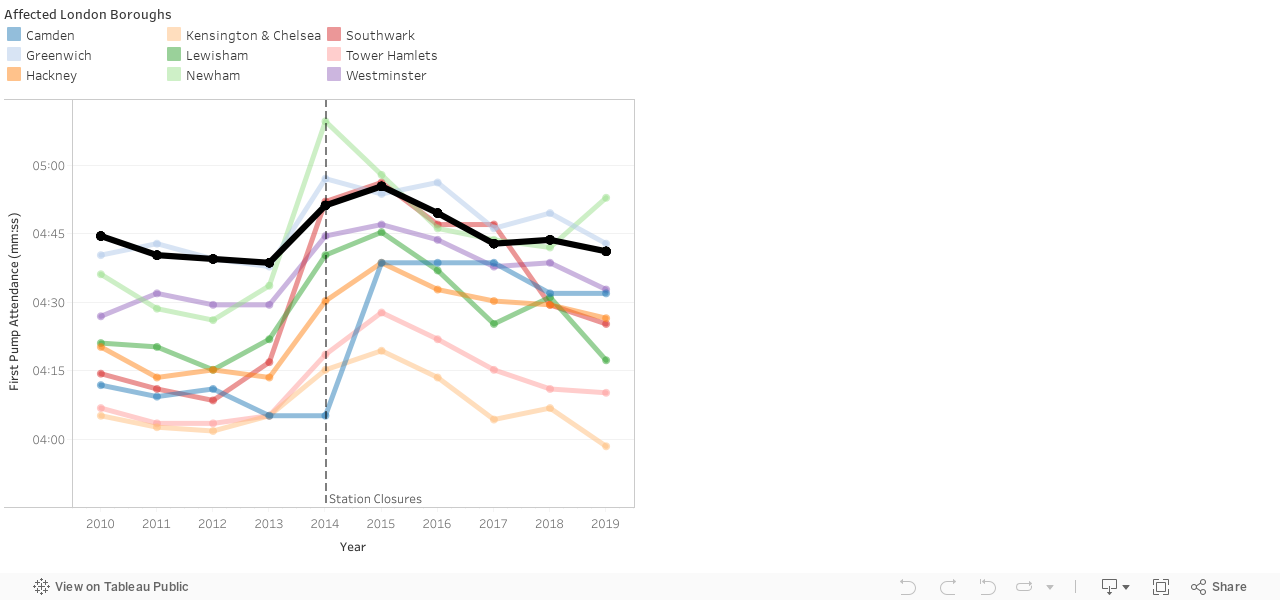
The chart below shows the average incident response times of the 9 London Boroughs affected by the station closures. It is clear that following the station closures in January 2014 the average reponse time did rise. It is interesting to compare the reponse times of the affected Boroughs to the heavy black line which shows the average response times across all London Boroughs. Most of the Boroughs affected by the closures largely perform better than the London average. Only a small number of Boroughs reach an average response over the London average and even then are not consistently poor. It's also worth noting that all of the Boroughs have an average well under the LFB target of 6 minutes.
Average incident response time comparison across affected Boroughs
The Changing Landscape Across London
The map below shows the changes in reponse times for each London Borough since the closures in 2014. Boroughs have been coloured to indicate the difference between the average response time before and after the closures. Green indicates an improved response time. Red indicates a poorer response time.
This more clearly shows the reduction in the response times for both the affected and some of the surrounding Boroughs. Camden and Southwark showing the largest increase in reponse times. It's also clear that elsewhere there have been a marked improvement with response times across some of the outer London Boroughs (especially in the west) being reduced.
It is crucial to note though that this map is showing the difference in reponse time before and after. An area like Southwark where response times have fallen by 35 seconds to 4 minutes 53 seconds still have a faster average response time compared to a Borough like Enfield who have a response time of 5 minutes and 40 seconds.
How response times have changed across London since the closures

Conclusions
It's clear when looking at the response times that performance in the Boroughs where stations were closed has diminished since Jan 2014.
However, when looking at performance across the rest of London the impact is maybe not as stark as it first appears. Most of the affected Boroughs recieve a service inline with that across the rest of London (if not better) and services are largely delivered within the KPI target of 6 minutes (keeping in mind the visualisations above are based on median averages).
Figures published by the Home Office on primary fire response times (not all incidents) show a national response time of 8 minutes and 45 seconds for the period 2017/18 which clearly suggests that LFB is operating effectively with times well under this average.
One of the issues with using response times alone as a performance measure is that they become arbitary. As previously stated, evidence suggests response times are important but depending on the scale & nature of incident and a range of complex factors it is difficult to truely understand the real impact that an increase of 10 or even 35 seconds might make.
Although I'm sure we would all like to see response times improve rather than dimisnish we live in difficult times where our Public Services are under increasing pressure to save money and cut budgets. I conclude that LFB should be commended for mitigating the impact of these cuts by carefully selecting areas that already had good coverage and were exceeding performance targets.
The question of whether we believe these performance times to be acceptable is more subjective. Incidents such as the Grenfell Tower Fire have only added to the scrutiny of services offered by the London Fire Brigade. Questions to Government over how these Public Services can continue to meet peoples raised expectations alongside decreasing budgets also largely go unanswered.
Maybe another question to explore in future is how much more would we be willing to pay to improve the response times of this vital public service?